| |
Obesity: Risks and benefits
Revised in March 2009
Keeping a sound perspective
Statistics on weight increases throughout the world can be alarming. In the United States two-thirds of adults are now overweight or obese, according to the Centers for Disease Control and Prevention (CDC). Similar increases are seen worldwide, with some of the highest rates of obesity found in Polynesian populations.(1)
The list of diseases and health risks supposedly caused by obesity – and even by overweight – is a long one. It includes hypertension, coronary heart disease, stroke, type 2 diabetes, cancers, gall bladder disease, glucose intolerance, respiratory diseases, osteoarthritis and many others headlined frequently in the daily newspaper. Warning bells are sounding the need for most people to lose weight.(2)
However, while weight has come to dominate health concerns, health and well-being encompass many other aspects of life – mind, body and spirit. Weight is only one small part of physical health, and may or may not affect an individual’s health adversely. Many large people are very healthy; many thin people are unhealthy.
As another part of the big picture, largely being ignored today, are life-threatening health risks for the many painfully thin girls and women in our culture who are under nourished
because of their desperate fear of fat. Underweight and nutrient deficiencies present severe problems in our culture.
So it's important that weight concerns not overshadow the need for growing children and adults to be fully nourished, moderately active and live in a nurturing environment. In the big picture it is total wellness that counts.(3) |
|
Despite the
risks
of obesity,
it is a mistake to exaggerate
those risks.
|
Despite the risks related to obesity, it is a mistake to exaggerate those risks. We need to recognize that special interest groups with strong lobbying power are involved – and a great deal of money. In the U.S. alone, $50 billion is spent annually on weight loss efforts. This drives much of what we read in the day’s headlines.
In addition, our culture has an undeniable bias against obesity. This also feeds into the exaggerations and misinformation that continually surge through the obesity field.(4)
In 2004, at the height of the official obesity hysteria, it was announced that obesity causes 400,000 deaths each year in the U.S. – rivaling deaths from smoking.(5) The previous year, as the Iraq war began, with its concerns of terrorists and nuclear weapons, Surgeon General Richard Carmona declared that the threat from obesity is worse than the threat of nuclear arms.(6)
But apparently that number was too high for many scientists. It was time to ask some hard questions and expect honest answers.
The first question:
1. How strong is the link between obesity and health risks?
The answer came shortly. In 2005, in a rigorous analysis of actual deaths in the U.S. over a 30-year period, research scientists with CDC’s National Center for Health Statistics, showed a figure closer to 112,000 deaths.(7)
Their study revealed a great deal more. Yes, these were serious health risks. But rather than being spread across the two categories of overweight and obese, they were confined to a relatively small segment of the population. The high risk came at the level of severe obesity, called grade 3 – a body mass index (BMI) of 40 or more. Fewer than five percent of U.S. adults reach this level.
For the one-third of the population in the overweight group no risk at all was found. In fact, it had the lowest health risk of any group, lower than the category labeled normal weight and often called healthy weight.
The researchers found seriously high risks in the underweight group. Further, their report of higher risks for the normal group supported a great deal of other research that suggests a BMI of 24 to 30 as the point of lowest risk.
A second question concerns the word cause: |
|
No risk found for
the overweight group
– one-third of the
population.
|
2. Does obesity cause the diseases associated with it?
For several decades research has shown an association between obesity and certain diseases. All that time it has been assumed that obesity causes these diseases.
This is a leap not allowed in credible science. But somehow health scientists seemed not to
notice.(8,9)
Association does not prove cause. This is basic science. When two factors are related – or linked – it is necessary to go a step farther and look independently a third factor (or factors) that may be causing both.
In this case the most likely third factors are genetics and inactivity. Yet, inexplicably, most studies that look at the risks of obesity fail to consider the role of inactivity in disease. This has led to much confusion and inappropriate health care.
When scientists do look at activity, they find it is more closely related to health risks than is obesity. Researchers with the long-running fitness studies at the Cooper Institute Aerobics Center in Dallas, TX. find that when obese persons are moderately or highly fit their mortality risk is no higher than for similarly active persons of normal weight.(10)
Following the major 2005 study by the National Center for Health Statistics, CDC quietly scaled back the number of annual related deaths to a science-based figure of 112,000 deaths.
The agency also disconnected the link between overweight and obesity when discussing risks. The CDC now refers to the risks of obesity alone (unlike some other federal agencies). But still CDC seems to pursue what has been called its “war against obesity.”
The third question begging consideration: |
|
"It ain't what you don't know that gets you into trouble. It's what you know for sure that just ain't so," cautioned Mark Twain.
He could have been talking about obesity issues.
Obesity is a complex issue. Yet it often has been oversimplified. Many believe it is caused simply by overeating and with a bit of willpower, any large person can slim down safely to a so-called healthy weight and stay there.
What many people know “for sure” is a great deal “that just ain't so" about obesity and weight loss. This is entirely understandable, since it cannot be denied that the public often has been misinformed and mislead.
Science is important in intelligent decision making, by establishing the true nature of the world around us. We need to be able to peel back the layers and learn more about the complexities of obesity.
However, publishing bias has led too often to distortions and inappropriate health care. Science makes our lives better, but it can hardly do that when the line between science and pseudoscience is deliberately obscured . |
|
3. Does weight loss improve health and longevity?
Weight loss is widely recommended for larger people. However, efforts to lose weight in a lasting way are almost invariably unsuccessful.
Any lost weight is soon regained.
Weight loss efforts may have immediate detrimental effects, and it is by no means clear that weight loss improves health or mortality risk. An increasing body of evidence casts this in doubt.(11,12)
Furthermore, it may enable “setpoint creep.” so that weight is ratcheted upward after each weight loss bout.(13)
Beauty, health and strength come in all sizes. However, society’s disapproval can be cruel. Size prejudice is found in health care, education, social relationships and many other aspects of daily living. In their work and careers, large people often meet size prejudice in hiring, advancement and salary.(15)
Being overweight or obese can be a severe social handicap. Children who are teased, labeled and stigmatized may have long-term damage to self-esteem and body concept.(16,17)
Some experts say that for children the most detrimental consequences of excess weight are probably not health risks, but emotional and psychological damage. They point out that, while cultural bias is powerful, it is not a reason to change the child, but rather to change the culture. Large children would be much happier in an accepting, nurturing environment, which they may not find in school, and sometimes not even in the home
Research tells us that large people are no different than thin people. Each is an individual and deserves to be regarded this way and treated with respect and acceptance.
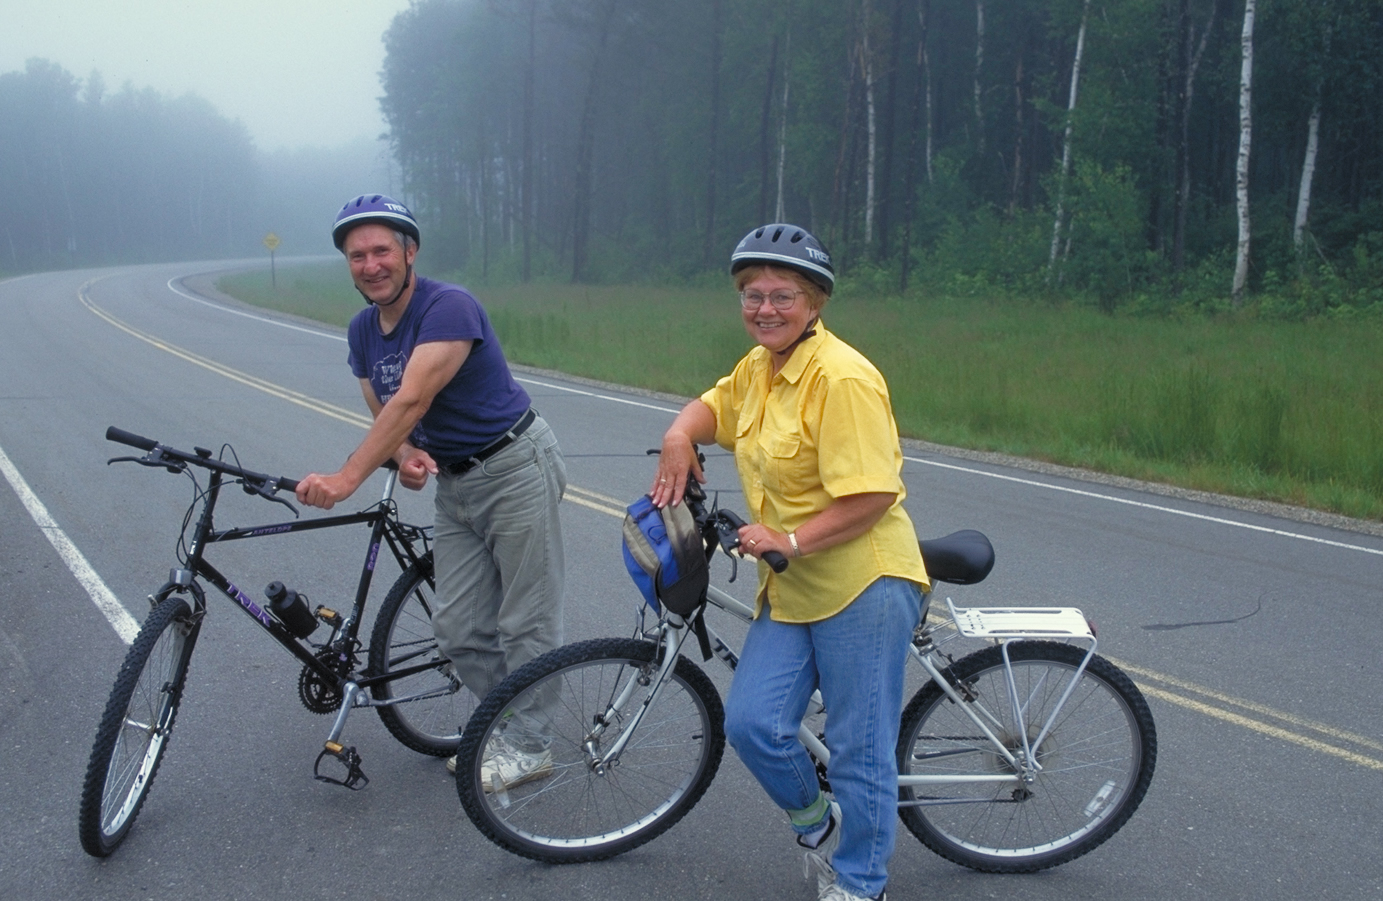
For most large people the key to good health may be simply leaving weight alone, and instead focusing on habits of moderate, regular physical activity and other aspects of healthy living.
The scientists at the Cooper Center advocate this kind of reasonable solution. They summarize the data and conclude:(18)
“We believe that public health would be better served with more comprehensive attempts to increase population levels of physical activity, rather than emphasizing ideal weight ranges and raising an alarm about increasing prevalence rates of obesity.”
| If our health system were truly intent on helping individuals with severe obesity, it |
Beauty, health and strength come
in all sizes.
|
|
seems it would move ahead with programs such as this, instead of continually sentencing them to one more untested weight loss experiment, their lives could be immeasurably better. |
A Feb. 26, 2009 editorial in the New England Journal of Medicine calls for a similar change of direction.
“We need a change of paradigm … We do not need another diet trial,” writes Dr. Martijn Katan. He’s right: the old paradigm, shaped by special interests and cultural biases, surely has had its day.(19)
So what is the big picture here? How do we sort out the facts and maintain a sound perspective in this complex and perplexing field?
Can we learn to distinguish between credible science and pseudoscience?
Can we recognize that serious health risks are associated with a segment of obesity, which may or may not cause them – while being aware of and unswayed by the exaggerations, publishing bias and fear mongering so common in this field?
References
- Obesity: preventing and managing the global epidemic. Report of WHO consultation on obesity. Contemp Nutr 1989;14:6.
- http://www.cdc.gov/nccdphp/dnpa/Obesity/ Accessed 3-16-09.
- Berg FM. Women Afraid to Eat: Breaking Free in today’s Weight-Obsessed World, 2001, p213-225. Healthy Weight Network: Hettinger, ND.
- Oliver, J. Eric Fat Politics: The Real Story Behind America's Obesity Epidemic, 2006. Oxford University Press: USA
- Mokdad AH, Marks JS, Stroup DF, Gerberding JL.Actual causes of death in the United States, JAMA. 2004;291:1238-1245.
- Campos, Paul. The Obesity Myth. 2004, p3. Gotham Books: New York.
- Flegal KM, Graubard BI, Williamson DF, Gail MH. Excess Deaths Associated With Underweight, Overweight, and Obesity. JAMA. 2005;293:1861-1867 (April 20, 2005). jama.ama-assn.org/cgi/reprint/293/15/1861.pdf
- Gaesser, Glenn. Big Fat Lies: The truth about your weight and your health, 1996.. New York: Ballantine Books.
- Berg. Women Afraid to Eat, p193-202.
- Farrell SW, Braun L, Barlow CE, Cheng YJ, Blair SN. Relation of body mass index, cardioresp fitness and all-cause mortality in women. Obes Res 2002 Jun;10(6):417-23.
- Lissner L, Odell P, et al. Variability of body weight and health outcomes in the Framingham population. New Engl J Med 1991;324:1839-44.
- Ernsberger P, Haskew P. Health implications of obesity: An alternative view. J Obes Weight Regulation, 6:55–137, 1987.
- Keesey RE. Physiological regulation of body energy: implications for obesity, in Obesity: Theory and Therapy, eds. Stunkard AJ and T Wadden, 1993:77-96. New York: Raven Press.1
- Brodney S, Blair SN, Chong Do Lee. Is it possible to be overweight or obese and fit and healthy? In Bouchard C (ed). Physical activity and obesity. Human Kinetics, Champaign 111., 2000. J of Eating Disorders 2000; 28: 215-220., Blair, Lee.
- Berg FM. Women Afraid to Eat: Breaking Free in today’s Weight-Obsessed World, 2001, p111-128. Healthy Weight Network: Hettinger, ND.
- Berg FM. Children and Teens Afraid to Eat: Helping Youth in Today’s Weight-Obsessed World, 2001, p142-152. Healthy Weight Network: Hettinger, ND.
- Berg FM. Underage and Overweight: Our Childhood Obesity Crisis – What Every Family Needs to Know, 2005, p195-205. Hatherleigh Press: NY.
- Brodney S, Blair SN. Is it possible to be overweight or obese and fit and healthy? 2000.
- Martijn B. Katan. Weight-Loss Diets for the Prevention and Treatment of Obesity. New Engl J Med 2009;360;9: 923-925. (Feb 26, 2009).
Risks and benefits of obesity
For U.S. adults, current research shows that associated risk linked to overweight and obesity is confined to the obese category (BMI of 30 and over). This was established by 2005 research led by Katherine M. Flegal, PhD, Senior Research Scientist at the National Center for Health Statistics, CDC. (1)
The overweight category shows no related risks at all and is, in fact, the weight group with the lowest related health risks. Therefore, since this is quite well established and confirms a great deal of other research, this section will focus its discussion on obesity.
In their 2006 analysis, the National Council of Health Statistics scientists show that of the health risks associated with obesity, most appear to be focused at the higher end, at grade 2 and 3, but primarily at grade 3, known as extreme or severe obesity, according to the National Health and Nutrition Examination Surveys (NHANES).(2)
Obesity is separated into three weight levels as below:
|
–
–
– |
BMI
30-34.9
35-39.9
40 and over |
In the latest figures, 32.2 percent of Americans are obese, with most of them at grade 1 and grade 2. Only 4.8 percent are at grade 3 obese.(3)
In their latest 2006 report, the CDC National Council of Health Statistics scientists separate out for special analysis only grade 3 – extreme or severe obesity (BMI 40+). Earlier, in
2002, they had analyzed separately both grade 2 and 3, while ignoring grade 1. Now grade 2 also has been dropped from special analysis.
Thus, current focus is on severe obesity at grade 3, perhaps suggesting this is the group of primary concern.
This is the group – less than five percent of the U.S. population – most closely associated with weight-related health risks.
While these are serious risks, it is not exactly a national crisis – or an epidemic. Further, it should be noted that just because the two are related does not mean that obesity causes the risks. Causes are not yet established. |
|
Most
health risks linked to obesity
are focused at the higher end, primarily
at
grade 3
– this includes less than 5 percent of Americans.
|
| |
| To determine BMI Divide weight by height squared using metrics (wt/ht2). |
| Divide pounds by height in inches, squared, times 703 (wt/ht2 x 703). |
| Or use the BMI chart in Children and Teens Afraid to Eat, page 312 |
|
|
The Flegal study: Overweight is the “healthiest” weight
A major finding of the 2005 Flegal study is that the overweight group (BMI 25 to 29.9) has the lowest death rate of any of the four weight categories. In effect, it is the “healthiest” group, rather than the lower-weight group officially designated as normal or healthy weight.(4)
Another major finding was the high excess mortality risk associated with underweight. This risk even extended up into the normal weight group. At the same time, the protective effect of the overweight group extended up into the lower levels of obesity (mild and moderate obesity).
When graphed, this shows a broad U-shape with high |
risks for both underweight and extreme obesity, and lower to no risks between them and even extending into mild and moderate obesity. Seen on a graph, this clearly suggests the current weight categories are set too low.Results are as follows:
| |
| Rate of excess mortality |
Underweight:
Normal weight:
Overweight:
Obesity: |
33,746
0
-86,094
111,909 |
|
As seen here, normal weight was used as the reference group and given zero value. Thus the negative figure for overweight shows the total fewer deaths below zero in the overweight group.
When the two leaner groups are compared with the two heavier groups, there are 7,931 more deaths in the leaner groups than the heavier groups (111,909 - 86,094 = 25,815). Thus, related risks for weights below a BMI of 25 were higher than for those with a BMI of 25 or higher.
These results show increased mortality associated with underweight and obesity, particularly with obesity at |
|
The analysis shows 7,931 more deaths in the two leaner groups, than in the two heavier groups.
|
the highest level. Only with more severe obesity was mortality risk similar to that of the underweight group. (5)
These revelations were startling to the public, even though they did not receive media attention commensurate with their importance at the time.
But it was not new information to those familiar with the research. The Flegal study only confirmed – albeit decisively – what many other studies were showing worldwide.(6)
For example, the 1998 NHLBI guidelines on identifying and treating overweight and obesity reviewed 236 randomized, controlled trials that suggest the level of lowest mortality at about BMI of 24 to 30.(7) Only a few studies, some infused with publishing bias, report opposing results.(8)
Related risks of obesity
CDC lists the following as diseases and health conditions associated with obesity
- Coronary heart disease
- Type 2 diabetes
- Cancers (endometrial, breast, and colon)
- Hypertension (high blood pressure)
- Dyslipidemia (for example, high total cholesterol or high levels of triglycerides)
- Stroke
- Liver and Gallbladder disease
- Sleep apnea and respiratory problems
- Osteoarthritis (a degeneration of cartilage and its underlying bone within a joint)
- Gynecological problems (abnormal menses, infertility)(9)
The specific ways that these linkages vary by cause of death was investigated by the same team as above, led by Katherine M. Flegal, PhD, of the National Center for Health Statistics, in their analysis of data on U.S. adults from the 1971-1994 NHANES studies, combined with other data and vital statistics for 2004.
In 2007 they reported that obesity was associated with increased deaths from cardiovascular disease (CVD), diabetes and kidney disease, and fewer deaths from noncancer, non-CVD causes. For older adults the association was weaker between CVD mortality and obesity, and disappeared entirely by age 70.(10)
Underweight was associated with increased deaths from noncancer, non-CVD causes (including respiratory and infectious diseases, injuries, suicide, Parkinson, Alzheimer’s, liver disease), and not associated with cancer or CVD mortality.
The overweight group had the lowest mortality. Compared with normal weight, it had lower risk from noncancer, non-CVD causes, somewhat higher risk for diabetes and kidney disease, and was not associated either way with cancer or CVD mortality.
Overall cancer mortality, which accounted for about 24 percent of total deaths, was not associated with any of the four weight categories. However, there were differences by type of cancer.
Obesity was more likely related to those cancers considered to be obesity-related, including colon, breast, uterine, ovarian, kidney and pancreatic cancers. These accounted for 32 percent of cancer deaths, with obesity significantly associated with 11 percent of these deaths.
Obesity was less likely related to lung and other cancers, which were 29 percent and 40 percent of cancer deaths, respectively.
On balance, obesity is not associated with increased risk for overall cancer deaths. It may be protective of some cancers, while more at risk for others.
| The authors say it has been suggested that higher risk in the underweight group is due to weight loss associated with cancer or CVD. But their results, as well as others cited, show the excess mortality is mainly associated with non-cancer, non-CVD causes, including respiratory problems (tuberculosis, choronic obstructive pulmonary disease, asthma and |
|
Obesity may be protective of some cancers, more at risk for others – on balance, obesity is not linked to risk for overall cancer deaths.
|
pneumonia). The results persist when controlled for smoking and when the first 5 years of deaths are excluded. Low BMI has also been shown to be a risk factor for mortality independent of disease severity.
While noncancer, non-CVD causes are often not considered weight-related, the scientists said they are significantly elevated in the underweight group, and seemed to hint these should be listed as health risks of underweight.(11)
Beneficial effects of obesity: the Obesity Paradox
It’s been called the Obesity Paradox, the idea that obesity has benefits as well as risks – apparently to suggest its rarity. Instead an increasing body of evidence shows numerous benefits.
The term was first used in connection with the higher survival rates found for obese patients than thinner people during and after hospitalizations for acute conditions, such as heart attacks.(12. Now it seems that higher survival rates are not as rare as previously thought, and not limited to hospital events.
The Obesity Paradox –
the idea that obesity has benefits as well as risks – is confirmed by an increasing body of evidence that shows numerous benefits.
|
Currently, it is recognized that obesity may be protective against a number of diseases and condidtions. This is not to imply that the beneficial effects and associations of obesity outweigh the harmful associations. But it may be the case that a person with severe obesity is more likely to develop a chronic disease, such as coronary heart disease, but also to survive longer its worst effects than a thin person. |
|
The question is being asked: When does a paradox stop being a paradox?
"It seems time to comprehensively revisit our thinking about obesity, especially in the context of chronic illnesses,” says a 2007 editorial in the journal Circulation. The editorial suggests that overweight and obese patients may survive longer because they have higher energy reserves.(13)
- Research shows survival rates are better for obese persons than non-obese patients with chronic heart failure, obstructive pulmonary disease, cancer, renal failure and liver cirrhosis.(14)
- In an acute lung injury study, in-hospital death was highest for the underweight group, lower for the normal weight group and at its lowest point for the obese and severely obese groups in a comprehensive study of adults that included 1,488 mechanically ventilated adults in 84 hospitals. Further, after discharge the underweight survivors were less likely able to return to their previous functional status. The researchers found no difference by age when patients under and over 65 were analyzed separately, and suggest that factors such as nutritional reserves play a beneficial role in the outcome.(15)
- Obese people with cardiovascular illness, pneumonia, HIV, high blood pressure, congestive heart failure, type 2 diabetes, cancer and high cholesterol, those needing hemodialysis and those who have undergone heart transplants all have better outcomes than lean people with the same conditions.
- Anemia is strongly correlated with lower BMI; so is disturbed sleep (however, sleep apnea is associated with obesity). Stomach ulcers are less common in large people.
- The higher a person’s BMI at the time of diagnosis of HIV infection, the greater chances of survival. Overall deaths from infectious disease, pneumonia and tuberculosis, decline with increasing body weight.
- High weight during pregnancy is more beneficial than harmful to the infant, although very large infants may pose more risks to the mother during birth.
- It has long been known that suicide rates are lower for overweight and obese men. This is consistent with the protective effect against major depression found for larger people.
Risk was lowered by 11 percent for each one unit increase of BMI in the 2007 Health Professionals Follow-up Study. Improved mental health-related quality of life also increased as the BMI increased.(16)
- Osteoporosis has been long recognized as a disease that benefits from obesity. Larger people have larger, stronger bones. A BMI of 26 to 28 is associated with higher bone mineral density compared with a BMI of 22 to 24.(17) Dieting, weight loss and being thin are seldom-acknowledged risk factors for osteoporosis.
One of the first researchers to compile statistics on the benefits of obesity, Paul Ernsberger, PhD, Associate Professor of Nutrition at Case Western Reserve University School of Medicine reported many of these findings in 1987.(18)
Now, 20 years later, Ernsberger says, “The impact of obesity on an individual may include both positive and negative influences on health. [However] the positive effects have been almost entirely neglected.”
Poverty is associated with obesity, he notes. Thus, in comparing health risks it is important to control for socioeconomic factors. Many studies have not done this.
Further, Ernsberger charges that “Compared with the vast efforts expended to chart the health risks of obesity, almost nothing is known about the very real health risks of leanness.”
“Compared with the vast efforts expended to chart the health risks of obesity, almost nothing is known about the very real health risks of leanness.”
|
|
Older adults benefit from higher weight
Health risks associated with severe obesity seem to be stronger for younger adults, and tend to disappear for older adults, particularly after age 70, as shown in the NHANES surveys.(19)
Numerous studies worldwide indicate that overweight and obesity seem to be protective of illnesses of old age compared with thinness or normal weight. Despite controlling for numerous factors, including functional |
– Paul Ernsberger, PhD
|
|
status and smoking, older people who are thin remain more likely to die. (20)
- A large study of older Americans showed that mortality was lowest for those with BMIs of 25 to 35 — the overweight to moderately obese range — with higher mortality rates for those with BMIs below 25 or above 35.(21)
- In another study, obesity had little or no effect on life expectancy in people 70 years or older.(22)
- The point of lowest death rate for women age 50 and over was at a BMI of 34 in one study, encompassing a broad U-shaped relationship between BMI and mortality.(23)
- Among American Indians, in the Strong Heart Study in four states, obesity seemed to matter even less. More than 75 percent are overweight or obese at middle-age and older, but this had only slight influence on risk factors for coronary heart disease. Waist circumference had no special effect. The authors say the relationship of obesity, body fat distribution, and heart disease risk may differ for Native Americans, and they cite a large study of Pima Indians that shows little relation between obesity and death rates.(24)
In a 2008 report of the Cardiovascular Health Study – a sample of 5,888 men and women age 65 and over in four U.S. communities, weighed and interviewed annually in clinic visits for 7 to 10 years – higher weight is associated with ease of daily living activities and better health as well as longevity.(25)
In the longterm Cardiovascular Health Study of men and women age 65 and older, higher weight is associated with better health, ease of daily living activities and longevity.
|
|
Both overweight and obese men, whether self-described as healthy or sick, had more expected years of life after age 65, more years of healthy life (self-rated as excellent, very good or good), and more active life expectancy (without daily living difficulties) than normal-weight men.
For women, outcomes in the overweight group were most favorable of all groups. For obese women results |
were somewhat mixed, but were generally better than or equal to the outcome for the normal weight group. (The researchers speculate that even in good health the obese women may have rated themselves lower, because of our cultural bias.)
Underweight was associated with poor outcomes in all comparisons.
These favorable findings for obesity in the Cardiovascular Health Study came despite the fact the researchers favored the normal and underweight groups by raising the cutoff point between them to a BMI of 20, since an earlier analysis had found high risks below that level. This improved outcomes for both groups, they explain. Otherwise what became the healthiest underweight people (between 18.5 and 20) would have been the sickest of the normal group.
Thus, even more convincingly, this favoring of the lower weights affirmed the more robust health and longevity of the overweight and obese groups.(26)
A higher weight can be especially protective of bone health for older persons. It’s a time when falls can be fatal – as noted above, about one-fourth of hip fractures lead to death within the year for patients age 50 and over. Favorable recovery from hospitalizations, too, is critically important as one grows older.
In spite of such favorable indications, many individuals with severe obesity may have serious problems with related illnesses, as well as difficulties with mobility, made more acute when physical activity is curtailed.
For older persons, unintentional weight loss often heralds a general decline. Even when controlled for current illness, weight loss shows increased risk for older persons. Keeping a stable weight or a moderate weight gain appears to increase longevity.
Weight loss intervention may be especially inappropriate for older adults, scientists say. Weight loss means loss of bone and muscle mass at any age, and food restrictions may compromise nutritional status in the elderly.
References
- Flegal KM, Graubard BI, Williamson DF, Gail MH. Excess Deaths Associated With Underweight, Overweight, and Obesity. JAMA. 2005;293:1861-1867 (April 20, 2005). jama.ama-assn.org/cgi/reprint/293/15/1861.pdf.
- Ogden CL, Carroll MD, Curtin LR, et al. Prevalence of overweight and obesity in the United Status, 1999-2004. JAMA 2006;295(13):1549-1555.
- Ogden. Prevalence of overweight and obesity,
- Flegal. Excess deaths associated with underweight, overweight and obesity, 2005.
- Flegal. Excess deaths associated with underweight, overweight and obesity, 2005.
- Clinical Guidelines on the Identification, Evaluation,and Treatment of Overweight and Obesityin Adults. Bethesda, Md: National Heart, Lung, and Blood Institute; 1998.
- Strawbridge WJ, Wallhagen MI, Shema SJ. New NHLBI clinical guidelines for obesity and overweight: will they promote health? Am J Public Health. 2000;90:340-343.
- Manson JE, Willett WC, Stampfer MJ, et al. Body weight and mortaty among women. JAMA. 1995;257:353–358
- http://www.cdc.gov/nccdphp/dnpa/Obesity/ Accessed 3-16-09.
- Flegal KM, Graubard BI, Williamson DF; et al. Cause-specific excess deaths associated with underweight, overweight and obesity. JAMA. 2007;298(17):2028-2037 (doi:10.1001/jama.298.17.2028). http://jama.ama-assn.org/cgi/content/abstract/298/17/2028.
- Flegal. Cause-specific excess deaths, 2007.
- Fonarow GC, Srikanthan P, Costanzo MR, Cintron GB, Lopatin M; ADHERE Scientific Advisory Committee and Investigators. An obesity paradox in acute heart failure: analysis of body mass index and inhospital mortality for 108 927 patients in the Acute Decompensated Heart Failure National Registry. Am Heart J. 2007;153(1):74-81.
- Von Haehling S, Horwich TB, Fonarow GC, Stefan D. Anker SD. Tipping the Scale: Heart Failure, Body Mass Index, and Prognosis. Circulation. 2007;116:588-590.
- Smith, Rebecca. Don’t lose weight after heart attack. telegraph.co.uk
- O'Brien JM, Phillips GD, et al. BMI independently associated with hospital morality in mechanically ventilated adults with acute lung injury. Critical Care Med 2006;34:738-744.
- Archives of Inter Med, March 12, 2007; Medline Plus NIH, March 13, 2007.
- Wardlaw, Gordon. Body weight influences osteoporosis risk. Healthy Weight J. 1996;10:1:8-9,12.
- Ernsberger P, Haskew P. Health implications of obesity: An alternative view. J Obes Weight Regulation, 1987, 6:55–137.
- Flegal KM. Excess Deaths Associated With Underweight, Overweight, and Obesity.
- Grabowski DC, Ellis JE. High body mass index does not predict mortality in older people: analysis of the Longitudinal Study of Aging. J Am Geriatr Soc, 2001 Jul;49(7):968-79.
- Al Snih S, Ottenbacher KJ, Markides KS, Kuo YF, Eschbach K, Goodwin JS. The effect of obesity on disability vs. mortality in older Americans. Arch Intern Med. 2007;167:774-780.
- Reynolds SL, Saito Y, Crimmins EM. The impact of obesity on active life expectancy in older American men and women. Gerontologist, 2005;45:438-444.
- Fontaine KR, Heo M, Cheskin LJ, Allison DB. Body mass index, smoking, and mortality among older American women. J Women's Health 98;7:1257-1261.
- Gray R, Fabsitz R, Cowan L, et al. Relation of generalized and central obesity to cardiovascular risk factors and CHD in American Indians: the Strong Heart Study. Int J Obes 2000;24:849-860.
- Diehr P, O’Meara ES, Fitzpatrick A, et al. Weight, Mortality, Years of Healthy Life, and Active Life Expectancy in Older Adults. J Am Geriatr Soc 56:76–83, 2008.
- Diehr. Weight, Mortality, Years of Healthy Life, 2008.
The key to health: fitness, not weight
| “We believe that public health would be better served with more comprehensive attempts to increase population levels of physical activity, rather than emphasizing ideal weight ranges and raising an alarm about increasing prevalence rates of obesity.” |
— S Brodney, SN Blair, CD Lee
Cooper Institute Aerobics Center
Dallas, Texas.(1) |
In 2004 at the height of the obesity hysteria, health officials announced that 400,000 annual deaths are caused by obesity – nearly as many as caused by smoking.(2) The US Surgeon General admonished the nation that this was a threat worse than nuclear threats.(3)
But wait a minute. It’s true that federal research does show clear associations between severe obesity and chronic disease. But it does not show cause.
Just because the two factors are related, how does this mean obesity causes a disease
such as type 2 diabetes? Maybe diabetes and its treatment with insulin in some ways promotes obesity? Or how about a third factor that may be causing both?
These questions seldom have been asked – or allowed – by researchers with special interests. |
|
Association does not prove cause.
A credible scientist
refuses to make this leap.
|
Rather, they have seemed more interested in fostering the assumption that obesity causesall ills associated with by it. Surprisingly, they were able to make this notion stick in the medical and popular press, without debate. Thus, it is assumed that obesity causes hypertension, diabetes, heart disease and all the rest.
As one scientist observes, this is akin to a mentality that would claim baldness causes heart disease, since the two are related. Would the toupee salesman, then, promote a toupee for treating heart disease? And would the public buy it?
Association does not prove cause. This is basic science. A credible scientist refuses to make this leap. Instead, when two factors are related, it is necessary to go one step farther and investigate whether a third factor or factors may be causing both.
The caveat is that for decades popular research has failed to do this. Oddly, for all this time, health scientists seemed not to notice.(4,5)
The Flegal team made the point plainly in their 2005 report that theirs was an analysis of associations only:
“Other factors associated with weight, such as physical activity, physical fitness, body composition, visceral adiposity or dietary intake might be responsible for some or all of the apparent associations of weight with mortality.”(6)
What? Fat not being held responsible for higher mortality? Instead, could inactivity or lack of fitness or other factors be responsible, even for all of it? A revolutionary idea, indeed.
The third factor
The most obviouos third factor of those that can be controlled is inactivity. However, inexcusably, most studies investigating the risks of obesity ignore the role of physical activity and even when noted, have not looked at it independently.
There is considerable evidence that physical inactivity plays a critical role in the development of both obesity and chronic disease. (In addition, it is recognized that .genetics and other factors are involved.)
When researchers look independently at activity and weight, they find that inactivity and lack of fitness may be more closely related to health risks than is obesity.
Scientists at the Cooper Institute Aerobics Center in Dallas have investigated the effects of physical activity for more than 30 years. They find that low cardiovascular fitness is an important independent predictor of all-cause mortality for both men and women, regardless of weight, regardless of whether they are slim or large.
Inactivity and a sedentary lifestyle may be an important cause of related health risks such as cardiovascular disease and diabetes, according to Cooper researchers. They cite numerous studies. |
|
“We strongly suggest that clinicians and other health professionals spend at least as much time encouraging sedentary women to become more physically active as encouraging overweight and obese women to lose weight.”
“If the height/weight charts say you are 5 pounds too heavy, or even 50 pounds or more too heavy, it is of little or no consequence healthwise — as long as you are physically fit. On the other hand, if you are a couch potato, being thin provides absolutely no assurance of good health, and does nothing to increase your chances of living a long life.”
“We believe that public health would be better served with more comprehensive attempts to increase population levels of physical activity, rather than emphasizing ideal weight ranges and raising an alarm about increasing prevalence rates of obesity.” |
— Dr. Steven Blair and colleagues
at the Cooper Institute Aerobics Center, Dallas, TX |
|
|
One 1995 Cooper Institute study that followed 25,389 men for 8.5 years shows the following:(7)
- For fit individuals there were no differences in relative risk in three different BMI categories. Fit and active obese men had no greater risk than fit and active lean men.
- Waist circumference and body fat differences showed the same results as those for BMI. It was fitness, not waist circumference, body fat or BMI that mattered in death rates.
- For diabetes, the risk of death was up to 4 times lower for men with higher fitness levels than nonfit men, irrespective of weight, age, parental history and even increased blood sugar.
- Obese men with low fitness had greater risk than lean men with low fitness.
“If the height/weight charts say you are 5 pounds too heavy, or even 50 pounds or more too heavy, it is of little or no consequence healthwise — as long as you are physically fit," says Dr. Steven Blair, president and director of research at the Cooper Institute.
"On the other hand, if you are a couch potato, being thin provides absolutely no assurance of good health, and does nothing to increase your chances of living a long life.”
A 2002 study of 9,925 women followed for 16 years at the Cooper Center, found that cardiovascular fitness, as measured by treadmill testing, made the difference in mortality rates, not BMI.(8)
- At every weight level, moderate or highly fit women had significantly lower all-cause risk of death than those who were low fit. The key to mortality risk was activity and fitness, not weight.
- Obesity of itself was not associated with higher mortality. The researchers warn that using BMI as a predictor of mortality risk in women may be misleading unless fitness is also considered.
- While fewer of the obese women were fit, those who were had no increased mortality risk. The researchers noted that the majority of women who are grade 3 obese are sedentary and nonfit. Thus, it can be misleading to use only BMI.
Fit obese men had no greater risk than fit lean men.
|
|
“We strongly suggest that clinicians and other health professionals spend at least as much time encouraging sedentary women to become more physically active as encouraging overweight and obese women to lose weight,” concluded the researchers.(9) |
Again, this is not startlingly new information. In 1999 Steven Blair and his colleagues analyzed data from 24 research articles and found they consistently show that active or fit men and women, including those who were overweight or obese, were protected from the risks of all-cause mortality, coronary heart disease, hypertension, type 2 diabetes mellitus and cancer. Active obese individuals consistently had lower morbidity and mortality than less active lean individuals.
In another part of the world, a 16-year follow-up study of 2,212 men and women in Finland that considered activity and fitness found weight (BMI) made no difference in mortality rate among either men or women. Instead, the key to higher death rates was physical activity as measured by fitness, leisure time activity and function.(10)
It is not true that all overweight and obese individuals are sedentary and nonfit, and this should not be assumed, warn the Cooper researchers. It is true that many obese persons are less active than are leaner persons, especially with severe obesity. However, this does not excuse using obesity as a proxy for inactivity. Many overweight and obese persons are very active and healthy.
They suggest that federal weight guidelines may be misleading unless fitness is taken into account.(11)
The failure of popular, highly-publicized research to investigate causes has led to much confusion. Undeniably, it also has led to what can only be termed inappropriate health care for larger persons. If |
|
The failure of popular research to investigate causes has led to much confusion and inappropriate health care.
|
inactivity is causing both obesity and a chronic disease, why would a knowlegeable health professional treat that disease by restricting calories – or with a diet pill?
For healthy interventions, see Weight Loss - Healthy Options: What does work.
References
- Brodney S, Blair SN, Chong Do Lee. Is it possible to be overweight or obese and fit and healthy? In Bouchard C (ed). Physical activity and obesity. Human Kinetics, Champaign 111., 2000. J of Eating Disorders 2000; 28: 215-220.
- Mokdad AH, Marks JS, Stroup DF, Gerberding JL.Actual causes of death in the United States, JAMA. 2004;291:1238-1245.
- Campos, Paul. The Obesity Myth. 2004, p3. Gotham Books: New York.
- Oliver, J. Eric Fat Politics: The Real Story Behind America's Obesity Epidemic, 2006. Oxford University Press: USA.
- Berg FM. Women Afraid to Eat: Breaking Free in today’s Weight-Obsessed World, 2001, p p193-202. Healthy Weight Network: Hettinger, ND.
- Flegal KM, Graubard BI, Williamson DF, Gail MH. Excess Deaths Associated With Underweight, Overweight, and Obesity. JAMA. 2005;293:1861-1867 (April 20, 2005). jama.ama-assn.org/cgi/reprint/293/15/1861.pdf.
- Barlow CE, Kohl HW III, Gibbens LW, Blair SN. Physical Fitness, mortality and obesity. Int J Obesity 1995;19 (Sup4):S41-44.
- Farrell SW, Braun L, Barlow CE, Cheng YJ, Blair SN. Relation of body mass index, cardiorespiratory fitness and all-cause mortality in women. Obes Res 2002 Jun;10(6):417-23.
- Farrell. Relation of body mass index, cardiorespiratory fitness, 2002.
- Haapanen-Niemi N, Miilunpalo S, Pasanen M, Vuori I, Oja P, Malmberg J. Body mass index, physical inactivity and low level of physical fitness as determinants of all-cause and cardiovascular disease mortality: 16 y follow-up of middle-aged and elderly men and women. Int J Obes Relat Metab Disord. 2000;24:1465-1474.
- Farrell. Relation of body mass index, cardiorespiratory fitness, 2002.
Causes of obesity
Obesity is a complex, multifactoral condition that baffles scientists at nearly every turn. While there have been advances, much about obesity remains unknown and the subject of intense debate.
There is much we don’t know about fat and weight gain — or what to do about it. Where does obesity start? What are the most vulnerable times? How powerful are genetic factors? If genetics is important, why are we seeing such sudden increases? What are the regulatory forces that, once obesity has developed, defend it so powerfully?(1)
Genetic: thrifty genes
Clearly, much does have a genetic basis. Family makes a difference. An easy answer for increasing prevalence is that our steepest population increases come in the very groups most vulnerable to obesity. More U.S. adults and children today than a generation ago come from racial and ethnic groups that have disproportionately high rates of obesity.(2)
Most vulnerable are children from some minority groups and families with low income and less education. About 20 percent of African American and Hispanic children are overweight at the 95th percentile.
The “thrifty genes” theory explains why. Under harsh conditions, only people who stored fat easily and were efficient in calorie use survived to pass on their genes.(3)
For example, only a hundred years ago, people such as Native Americans often lived under conditions of extreme privation. Their bodies were well regulated to survive periodic hunger and often intense cold. In good times this regulation protected fat storage and conserved calories and, in hard times, enabled survival.
Contrast this with people of European descent who have 10,000 years of agriculture and protected living conditions behind them to support an inefficient body regulation. They are less likely to store fat easily, because historically they needed it less.
Thrifty genes, then, imply – not that people are destined to be large – but that they have a vulnerability to gain weight easily under modern conditions, such as sedentary living and today's abundance of high-fat, high-sugar, good-tasting foods.
Our steepest population increases come in the racial and ethnic groups groups most vulnerable to obesity.
|
|
Inactivity and abundant food
Sedentary living appears to be a major factor promoting the accumulation of excess body fat through life. Likely it is the most important factor under our control. Adults and children in modern countries today are, on average, far less active and more sedentary than people have ever been before. In the U.S. only about one-fifth of adults are regularly active during their leisure time.(4) |
Considerable evidence suggests, on the other hand, that being moderately active on a daily basis through life is important in protecting against excessive fat gain.
It is protective against many diseases and adverse health conditions, as well.(5)
Food counts, too, but maybe not as much as previously thought, and maybe only when high calorie foods are teamed with sedentary living.
Many people believe obesity is almost entirely an overeating problem – simply too many calories consumed. But this is obviously an oversimplification; research fails to show that calorie intake has increased much over the years.
So is it the wrong kinds of foods: fast foods, “junk food,” too much fat or soft drinks, too much candy or alcohol, too little fiber? Again, the answers are unclear. Research fails to show that one kind of food or another can independently make a difference. Over-consumption of rich foods may well be part of the problem when combined with sedentary living, according to lab animal studies by Wayne C. Miller, PhD, and colleagues at the University of Illinois at Chicago in 1984.(6)
Life's milestones
There are certain times in life when people are especially vulnerable for the development of obesity. These are identified by the World Health Organization as follows:(7)
- Prenatal. Nutrition during fetal life may affect development of size, shape, body composition and the way the body handles nutrients. Some evidence suggests starvation during pregnancy may induce more efficient metabolism and fat storage for the infant.
- Adiposity rebound. Early pre-school years are a time of rapid growth and lower body fat, followed by a rapid rebound in fat.
- Adolescence. Body changes are striking at puberty. For boys there is usually a big increase in muscle and height. For girls, puberty usually brings increased fat deposition, along with the soft curves of maturity. Teenage girls are likely to become less active and eat in chaotic ways, which can make them especially prone to weight gain.
- Early adulthood. Again there may be marked reduction in physical activity for both man and women. Maturity brings adult changes, increased bulk and often weight gain.
- Pregnancy. Weight gain for mothers averages about one pound for each child, but with wide variation: one third of women add considerable weight with each pregnancy. The more pregnancies, the stronger is the likelihood of weight gain.(8)
- Menopause. Women typically experience a metabolic slow-down, resulting in some weight gain during and soon after menopause. This may be considered protective of bone mass at a time of increased risk for bone density loss and osteoporosis.(9,10)
Of these vulnerable times, three can especially affect women with major weight gains – puberty, pregnancy and menopause. Genetic factors make a difference here, too.
Other factors, some positive
Of the many factors affecting overweight and obesity increases worldwide, not all are detrimental. In the U.S., much of the rise comes from big population increases in the ethnic/racial groups most susceptable to obesity – those with “thrifty genes.”
Another big increase simply comes from the questionable ***change of definition in 1998* [link to Contr - too low?]*, which dropped weight categories to a lower level.(11)
Smoking cessation has likely contributed significantly to the increase in obesity over the last few decades. Smoking rates have dropped by more than half, from nearly 42 percent of U.S. adults in 1964 to less than 20 percent today.
Even being a more highly-medicated society has added pounds. Hardly cause for alarm – or reason for fearmongering.(12)
Faced with the failure of old approaches to weight loss and prevention strategies, researchers are asking new questions:
Is fat storage fostered by chronic dieting, by yo-yoing weight up and down? Does obesity begin in early childhood through excessive fat cell development that cannot be reversed? What about family eating patterns and parental persuasions to eat more – or eat less? How about depression, stress, sleep deprivation, metabolic changes, or even inflammation or viruses?(13)
The book Underage and Overweight: Our Childhood Obesity Crisis – What Every Family Needs to Know discusses more than 20 likely causes affecting excessive weight gain.(14)
Factors such as these can all be part of the equation, some more important for certain individuals than others. In sum total, body weight is likely to be the result of genes, metabolism, behavior, environment, culture and socioeconomic status.
References
- Prentice A. Manipulation of dietary fat and energy density and subsequent effects. Am J Clin Nutr 1998;67(Suppl) :535‑541S.
- Mayer J. Genetic factors in human obesity. PubEd workshop report, p27. Ann NY Acad Sci 1965;131:412‑421.
- Berg F. Thrifty gene may set stage for obesity in blacks. HWJ/Obesity & Health 1991:5:1:6-7.
- USDHHS. 1996. Physical Activity and Health: A report of the Surgeon General. CDC, National Center for Chronic Disease Prevention and Health Promotion, Atlanta, GA.
- Brodney S, Blair SN, Chong Do Lee. Is it possible to be overweight or obese and fit and healthy? In Bouchard C (ed). Physical activity and obesity, Human Kinetics, Champaign 111.
- Miller WC. Our fat rich, sugar rich diet. HWJ/I Obesity Newsl. 1987;1:7:1-3.
- Obesity: Preventing and managing the global epidemic. Report of a World Health Organization Consultation on Obesity. WHO/NUT/NCD/98.1. 1998. Geneva, Switzerland: World Health Organization.
- Rossner S. et al. Obesity Research 1996;4:3:271‑276.
- Wing R, Matthews K, et al. Arch Intern Med 1991;151:97‑102.
- Berg FM. Weight gain in menopausal years. Healthy Weight J 1994;8:4:69‑70.
- NIH-NHLBI Clinical Guidelines on Identification, Evaluation, and Treatment of Overweight and Obesity. National
Institutes of Health, National Heart, Lung, and Blood Institute. Pre-print June 1998. Bethesda, MD.
- Fernstrom M. 1996. Psychiatric drugs and weight gain. In Progress in obesity research 7th Ed., ed. Angel A, et al. p641‑647. London: John Libbey & Co.
- Berg FM. Women Afraid to Eat: Breaking Free in today’s Weight-Obsessed World, 2001, p96-110. Healthy Weight Network: Hettinger, ND.
- Berg FM. Underage and Overweight: Our Childhood Obesity Crisis – What Every Family Needs to Know, 2005. Hatherleigh Press: NY.
Prevalence of overweight and obesity
In the United States, the prevalence of obesity increased sharply during the early 1980s and kept rising until about 2003-2004. Since then there has been a leveling off for both adults and children.(1)
Statistics below come from the National Health and Nutrition Examination Surveys (NHANES) conducted by CDC’s National Center of Health Statistics (NCHS), which periodically gathers measured data on representative samples of Americans throughout the country.
Since 2003-2004 there has been a leveling off of
weight gain for both children and adults.
|
|
Adult obesity: by sex and age
Currently 32 percent of adults are obese.The rate of extreme obesity (BMI of 40 or higher), in which associated health risks are highest, is 4.8 percent, with highest rates at age 20-59.
Another 34 percent of American adults are overweight by definition, but since this category has been shown by the same NCHS scientists to be the level associated with the lowest health risk, analysis of the overweight group is not included here and below.(2)
|
For both men and women the highest obesity rates are found in the 40-59-year age group, with a weight decline after age 60.
| |
Percent obese
BMI 30 or higher |
Percent grade 3
obese
BMI 40
or higher |
|
| All (men / women) |
32.2% |
4.8% |
|
| MEN |
|
WOMEN |
| |
Percent obese
BMI 30 or higher |
Percent grade 3 obese
BMI 40
or higher |
|
|
Percent obese
BMI 30 or higher |
Percent grade 3 obese
BMI 40
or higher |
|
| All |
31.1 |
2.8 |
|
All |
33.2 |
6.9 |
| |
|
|
|
|
|
|
| AGE |
|
|
|
AGE |
|
|
| 20-39 |
28.0 |
3.1 |
|
20-39 |
28.9 |
8.0 |
| 40-59 |
34.8 |
2.7 |
|
40-59 |
38.8 |
7.9 |
| 60+ |
30.4 |
2.5 |
|
65+ |
31.5 |
3.3 |
|
|
Race and ethnic disparities
Large race/ethnic disparities are evident among women. About 54 percent of black women and 42 percent of Mexican-American women are obese compared with about 30 percent of white women. At age 40 to 59, nearly 58 percent of black women are obese. Rates of extreme obesity for black women are double or more those of white or Mexican American women (14.7%, 5.8% and 7.8%, respectively).(3)
Among men, the prevalence of obesity does not differ significantly by racial/ethnic group. However, for black men the rates of severe obesity are double or more that of the other men; all male groups have much lower rates of severe obesity than women.
| MEN |
|
WOMEN |
| |
Percent obese
BMI 30 or higher |
Percent extreme obese
BMI 40
or higher |
|
|
Percent obese
BMI 30 or higher |
Percent extreme obese
BMI 40
or higher |
|
| All |
31.1 |
2.8 |
|
All |
33.2 |
6.9 |
| |
|
|
|
|
|
|
| White |
31.1 |
2.8 |
|
White |
30.2 |
5.8 |
| Black |
34.0 |
5.4 |
|
Black |
53.9 |
14.7 |
| Mexican Americans |
31.6 |
1.7 |
|
Mexican Americans |
42.3 |
7.8 |
|
| Note: for analyzing purposes the white and black groups do not include Hispanic men and women, who are represented by the Mexican American group. |
|
Worldwide increases
Similar increases are seen worldwide. There is every reason to expect that obesity and its associated health risks, especially as related to sedentary lifestyles, will extend globally into the future as developing countries modernize.
For example, obesity among adults in Great Britain nearly tripled between 1980 and 2002.(4)
Some of the highest rates of obesity in the world are found in Polynesian populations, as people move from rural areas to the cities, changing both their activity levels and nutrition practices. About 77 percent of women in American Samoa and 63 percent of native Hawaiian women have a BMI of 27.3 or more. One study of native Hawaiians found an average BMI of 31 for both men and women.(5)
Obesity is less common in Africa and Asia. It is more prevalent and growing in urban areas as people move from rural villages to the cities. In Asian cities, there is growing concern for escalating rates of both obesity and eating disorders. It should be noted that for many countries statistics are incomplete and not based on representative samples.
Childhood overweight
For children age 2-19 the terms at risk and overweight are used for the two higher weight levels. About 16 percent of children and adolescents are overweight at the 95th percentile or higher, and another16 percent at risk at the 85th to less than 95th percentile, according to the 2000 CDC growth charts.(6)
Technically, the term obese is not used for youth. This was determined in efforts to avoid stigmatization of children, and its potential for adverse effects, including disturbed eating, harmful weight loss efforts, nutrient deficiencies, body hatred and size harassment.
However, today there is considerable pressure from some special interest groups to change the definitions to overweight and obesity. Some experts say using the term obese children would bring it more in line with terms for adults. Also, it is expected this would make treatment for children more eligible for insurance and perhaps for prescription weight loss drugs and surgery (whether determined safe and effective or not).
| Children and teens by gender and age |
| |
Percent overweight |
| |
85th percentile or higher |
95th percentile or higher |
97th percentile or higher |
|
| All |
31.9% |
16.3% |
11.3% |
|
| MALE |
|
FEMALE |
| |
Percent overweight |
|
|
|
|
|
| |
85th percentile or higher |
95th percentile or higher |
97th percentile or higher |
|
|
85th percentile or higher |
95th percentile or higher |
97th percentile or higher |
|
| All |
32.7 |
17.1 |
12.2 |
|
All |
31.0 |
15.5 |
10.5 |
| |
|
|
|
|
|
|
|
|
| AGE |
|
|
|
|
AGE |
|
|
|
| 2-5 |
25.5 |
12.8 |
9.0 |
|
2-5 |
23.3 |
12.1 |
7.9 |
| 6-11 |
33.9 |
18.0 |
11.7 |
|
6-11 |
32.6 |
15.8 |
11.1 |
| 12-19 |
34.9 |
18.2 |
13.9 |
|
12-19 |
33.3 |
16.8 |
11.1 |
|
| This combines the four years from the 2003-2004 and the 2005-2006 NHANES surveys, since results were not significantly different. |
|
Discrepancies in race and ethnicity
Differences among race and ethnicity show that among boys, overweight is higher for Mexican American than black or white boys, and for girls, it is higher among black and Mexican-American girls than white girls.
| |
Percent overweight |
| |
95th percentile or higher |
97th percentile or higher |
|
| All (age 2-19) |
16.3% |
11.3% |
|
| MALE |
|
FEMALE |
| |
Percent overweight |
|
|
|
|
| |
95th percentile or higher |
97th percentile or higher |
|
|
95th percentile or higher |
97th percentile or higher |
|
| All |
17.1 |
12.2 |
|
All |
15.5 |
10.5 |
| |
|
|
|
|
|
|
| White |
15.6 |
10.6 |
|
White |
13.6 |
8.5 |
| Black |
17.4 |
13.9 |
|
Black |
24.1 |
18.0 |
| Mexican American |
23.2 |
17.7 |
|
Mexican American |
18.5 |
13.2 |
|
|
Trends in child overweight
As with adults, overweight rates for children increased steadily after the 1970s, when they had been fairly stable, through the 80s and 90s, and have since leveled off. Changes between 2003-2004 (17.1 percent) and 2005-2006 (15.5 percent) were not significant, so these four years are combined, with the resulting total at 16.3 percent of children and teens overweight.(7,8)
| Percent overweight |
| 1963 to 1970 |
5% |
| 1988 to 1994 |
11 |
| 1999 to 2000 |
13.9 |
| 2003 to 2004 |
17.1 |
| 2003 to 2006 |
16.3 |
|
Definitions of adult overweight and obesity
Obesity has been defined as excessive storage of energy in the form of fat. This is difficult to determine, so instead, body mass index (BMI), a measure of weight and height, is used as a proxy.
The following weight categories were set in 1998 for adults.(9)
|
| |
|
BMI |
| Underweight |
<18.5 |
| Normal weight |
18.5-24.9 |
| Overweight |
25 - 29.9 |
| Obesity |
30+ |
| |
Grade 1 |
30-34.9 |
| |
Grade 2 |
35-39.9 |
| |
Grade 3 |
40+ |
|
|
BMI is based on the assumption that higher weight equals higher body fat. This is more accurate for population groups than for individuals, since many fall outside average fat levels. It is recommended that BMI be used as a screening tool rather than an important criterion of health.(10)
| To determine BMI Divide weight by height squared using metrics (wt/ht2). |
| Divide pounds by height in inches, squared, times 703 (wt/ht2 x 703). |
| Or use the BMI chart in Children and Teens Afraid to Eat, page 312 |
|
|
The weight categories, set by an NHLBI group in 1998, remain controversial. They assume related health risks begin at a BMI of 25, which is not supported by research.(13)
Current CDC research shows that overweight, as defined above, is associated with the lowest mortality risk of all categories, lower than so-called normal weight. The obese category also showed relatively low risk at the lighter end, for grade 1, which includes about half of the obese group.(14)
Together the two heavier categories are associated with lower risk than the normal and underweight categories. Underweight is associated with high risk of death.
Definitions for child at risk and overweight |
| |
CDC growth charts set in 2000 are used to plot percentile rankings for |
children. The charts are based on BMI-for-age and differ for girls and boys. For children the terms at risk and overweight are used for the two highest weight levels.(15)
|
| |
Weight level |
| Underweight |
Less than 5th percentile |
| Healthy weight |
5th to less than 85th percentile |
| At risk |
85th to less than 95th percentile |
| Overweight |
95th percentile or higher |
|
|
References
- New CDC Study Finds No Increase in Obesity Among Adults; But Levels Still High. CDC news release 11/28/2007. http://www.cdc.gov/nchs/pressroom/07newsreleases/obesity.htm]
- Ogden CL, Carrol MD, Curtin LR, McDowell MA, Tabak CJ, Flegal KM. Prevalence of overweight and obesity in the United States, 1999-2004. JAMA. 2006;295(13):1549-1555.
- Ogden. Prevalence of overweight and obesity.
- Ogden. Prevalence of overweight and obesity.
- Obesity: prevention and managing the global epidemic: Report of a WHO consultation on obesity. WHO/NUT/NCD/98.1. 1998. Geneva, Switzerland: World Health Organization.
- Ogden CL, Carrol MD, Flegal KM. High Body Mass Index for Age Among US Children and Adolescents, 2003-2006. JAMA. 2008;299(20):2401-2405.]
- Ogden. High body mass index children and adolescents, 2008.
- http://www.cdc.gov/NCCDPHP/dnpa/obesity/trend/index.htm
- NIH-NHLBI Clinical Guidelines on Identification, Evaluation, and Treatment of Overweight and Obesity. National Institutes of Health, National Heart, Lung, and Blood Institute. Pre-print June 1998. Bethesda, MD.
- Surgeon General’s call to action to prevent and decrease overweight and obesity: measuring overweight and obesity. CDC Dec 2001.
- Berg FM. Underage and Overweight: Our Childhood Obesity Crisis – What Every Family Needs to Know, 2005, p6. Hatherleigh Press: NY.
- Berg FM. Children and Teens Afraid to Eat: Helping Youth in Today’s Weight-Obsessed World, 2001, p312. Healthy Weight Network: Hettinger, ND.
- Flegal KM, Graubard BI, Williamson DF, Gail MH. Excess Deaths Associated With Underweight, Overweight, and Obesity. JAMA. 2005;293:1861-1867 (April 20, 2005). jama.ama-assn.org/cgi/reprint/293/15/1861.pdf
- Strawbridge WJ, Wallhagen MI, Shema SJ. New NHLBI clinical guidelines for obesity and overweight: will they promote health? Am J Public Health. 2000;90:340-343.
- US Health and Human Services. Healthy People 2010, Conf edition. Washington, DC, Jan 2000. See www.health.gov/healthypeople
Myths and misconceptions in healthcare
Many health professionals today have moved on to a healthy
living diet-free approach of sound and compassionate care in dealing with
weight issues. Unfortunately, however, many others promote and provide care that is based on misinformation, myth and size bias,
rather than accurate and up-to-date scientific information.
Consider these myths, misconceptions and controversies:
1. Obesity causes severe health risks
Unknown, but seems doubtful. Obesity has
been associated with in the past and assumed to cause a higher risk for type 2 diabetes, hypertension and cardiovascular disease. More recent federal research questions this. The evidence indicates these risks, as well as obesity itself, are likely caused by other factors, especially genetics and inactivity. (Increased physical activity dramatically reduces risk without weight loss.) (1,2,3,4,5,6,7)
2. Thinner is healthier
False. The lowest death rate according to the latest federal research
is within the “overweight” range (BMI of 25 to 29.9) and up to BMI 35. Lower weight and extremes of higher weight are linked to increased risk in a “U” curve. This confirms much earlier research, including a 1998 review of 236 controlled studies by the National Institutes of Health that found the lowest risk associated with a BMI of about 25 to 27. (Despite this evidence from their own studies, federal agencies continue to define normal or healthy weight at a much lower point, a BMI of only 18.5 to 24.9.) (8,9,10)
3. Losing weight reduces risk
False. Long-term studies indicate higher risk with weight
loss. Higher death rates weight loss are shown by more than 15 large comprehensive studies,
including the Framingham Heart Study, Harvard Alumni Study and NHANES follow-up.
Researchers suggest the loss of lean mass from bones, muscle, heart and organs may be jeopardizing
health, especially for older people.(11,12,13,14,15)
4. Obese people can lose weight safely and permanently
False. No current methods are proven safe and effective; all can be considered experimental. Dieting causes short-term weight loss lasting no more than six months, followed by regain, and leads to food preoccupation, bingeing, dysfunctional eating and sometimes eating disorders; also it causes weight cycling, a known mortality risk. Drugs offer only minimal weight loss (5-11 pounds) and must be taken long-term, with increased risk; of 6 million adults who took fen-phen/Redux, FDA reports one-third developed leaky heart valves, some fatal, and others died of primary pulmonary disease. Gastric surgery carries risk of nearly 5% mortality rate in the first year (nearly 50% death rate for age 75 and over) in a recent Medicare study, as well as over 60 complications, including severe infection, leaks, blood clots and malnutrition.(16,17,18,19,20,21,22,23)
5. Scaring people about weight promotes weight loss and obesity prevention,
and does no harm
False. Research shows that the increasing pressures to lose weight over the
past 30 years are paralleled by increases in obesity. Far from doing no harm, these pressures appear
to have backfired and led to widespread nutrient deficiencies, dangerous weight loss efforts, eating
disorders, malnutrition, occasional deaths, body hatred and size harassment.(24,25,26,27,28,29,30,31)
These misconceptions primarily benefit the weight loss industry, not the public or health community.
The fiction they keep alive is that overweight is a severe health risk that threatens most adults and adds greatly to health care costs; therefore, weight loss is urgently needed – even when it is unsafe and ineffective long term. A
more appropriate healthy living approach emphasizes moderate and regular activity, normal eating without
dieting, acceptance, respect, and physical, emotional and spiritual well-being for children and adults of all sizes.
Handout: Five Health Care Myths
References
- Taylor R. Causation of Type 2 diabetes – The Gordian knot unravels. N Engl J Med 2004;350:639-641.
- Miller W. Health promotion strategies for obese patients. Healthy Weight J 1997:11:3:47-51.
- Blair SN, Kohl HW, Barlow CE. Physical activity, physical fitness, and allcause mortality in women: do women need to
be active? J Am Coll Nutr 1993;12(4):368371.
- Barlow CE, Kohl HW III, Gibbens LW, Blair SN. Physical fitness, mortality and obesity. Int J Obesity 1995;1 (Suppl
4):S41-44. Miller W. Health promotion strategies for obese patients. Healthy Weight J 1997:11:3:47-51.
- Blair SN, Bodney S. Effects of physical inactivity and obesity on morbidity and mortality: Current evidence and research
issues. Medicine and Science in Sports and Exercise 1999;31:S646-S662.
- Flegal KM, Graubard BI, et al. Excess deaths associated with underweight, overweight, and obesity. JAMA 2005;293:1861-1867.
- Berg FM. Underage and Overweight: Our Childhood Obesity Crisis – What Every Family Needs to Know, 2005, 2004,
p13-29, 147-151. New York: Hatherleigh Press.
- Flegal. Excess deaths, 2005.
- NIH-NHLBI Clinical Guidelines on Identification, Evaluation, and Treatment of Overweight and Obesity. National
Institutes of Health, National Heart, Lung, and Blood Institute. Pre-print June 1998. Bethesda, MD.
- Berg FM. Women Afraid to Eat: Breaking Free in today’s Weight-Obsessed World, 2001, p200-202, 206. Healthy Weight Network: Hettinger, ND.
- NIH Technology assessment conference: Methods for voluntary weight loss and control. Conference report, program
and abstracts. March 30-April 1, 1992. Office Medical Research, Bethesda, MD 20892.
- Andres R, Muller DC, Sorkin JD. Long-term effects of change in body weight on all-cause mortality: a review. Ann
Intern Med 1993;119:737-743.
- Williamson DF, Pamuk E, Thun M, et al. Prospective study of intentional weight loss and mortality in never-smoking
overweight US white women aged 40-64 years. Am J Epidemiol 1995;141:1128-1141.
- Allison DB, Zannolli R, Faith MS, et al. Weight loss increases and fat loss decreases all-cause mortality rate: results
from two independent cohort studies. Intl J Obesity 1999;23:603-611.
- Berg FM. Underage and Overweight, 2005, p13-29, 156-194.
- NIH Technology assessment conference: Methods for voluntary, 1992.
- Lee IM, Paffenbarger RS Jr. Is weight loss hazardous? Nutr Rev 1996;54(suppl):S116-124.
- Berg FM. Underage and Overweight, 2005, p156-194.
- Kassirer JP, Angell M. Losing weight: An illfated New Year’s resolution. New Engl J Med 1998;338:5254.
- Garner DM, Wooley SC. Confronting the failure of behavioral and dietary treatments for obesity. Clin Psych Rev 1991;11:729-780.
- Lissner L, Odell P, et al. Variability of body weight and health outcomes in the Framingham population. New Engl J Med 1991;324:1839-44.
- Flum DR, Salem L, et al. Early Mortality Among Medicare Beneficiaries Undergoing Bariatric Surgical Procedures. JAMA 2005;294:1903-1908.
- Berg FM. Health risks associated with weight loss and obesity treatment programs. J Social Issues. 1999;55:2:277-297.
- Third report on nutrition monitoring in the US, Vol 1-2, Dec 1995. Life Sciences Research Office, US Health/Human
Serv, US Dept of Agriculture. Natl Ctr for Health Statistics, NHANES III. Advance Data Nov 14, 1994.
- Berg FM. Underage and Overweight, 2005, p76-94, 195-205.
- Levine P. President’s message. Eating Disorders Awareness and Prevention Newsletter. Spring 1995:1-3.
- Pipher M. Reviving Ophelia. 1994. Ballantine Books, Random House, NY.
- Fallon P, M Katzman, S Wooley, edits. Feminist perspectives on eating disorders. 1994. Guilford Press, NY.
- Grange D, J Tibbs, J Selibowitz. Eating attitudes, body shape, and self-disclosure in adolescent girls and boys. Eating
Dis 1995:3:3:253-264.
- Smolak L, M Levine. Toward an empirical basis for primary prevention of eating problems with elementary school
children. Eat Disorders 1994;2:4:293-307.
- Berg FM. Children and Teens Afraid to Eat: Helping Youth in Today’s Weight-Obsessed World, 2001, p31-50. Healthy Weight Network: Hettinger, ND.
CONTROVERSIES
|
|